TL;DR
- This free workbook plans a Dynamics 365 rollout by phase and task, with owners, dates and predecessors.
- It weights percent complete by duration and flags a task that starts before its predecessor finishes.
A rollout plan usually lives in a slide deck, and slides do not recalculate. My ERP implementation project plan template is a working workbook. You type tasks, dates and costs, and it rolls them up by phase.
Download the ERP implementation project plan template. It is a plain .xlsx with no macros and no sign-up.
Video walkthrough
This short captioned walkthrough moves through the three working sheets in order. It starts with the phase rollup, then shows how a dependency conflict appears on the task list, and ends with the headline numbers on the dashboard. Watch it first if you want the shape of the file before you open it.
Who this plan is for
I wrote this for project leads who run a Dynamics 365 rollout and need more than a slide. It suits a customer project manager working with a partner, or a partner lead who wants one shared view. If you are still choosing help, read how to choose a partner first.
The plan assumes you know your scope. It does not tell you what to build. If you want outside help with that, our services page explains how we work with rollout teams. Budget context comes from Business Central pricing.
What is in the workbook
There are four sheets in a fixed order, and each one does a single job. Instructions covers setup and the import route. Phases holds budgets and rollups. Tasks holds the schedule and the flags. Dashboard holds the status date and the headline numbers that the rest of this page quotes from the sample.
- Instructions covers setup and limits.
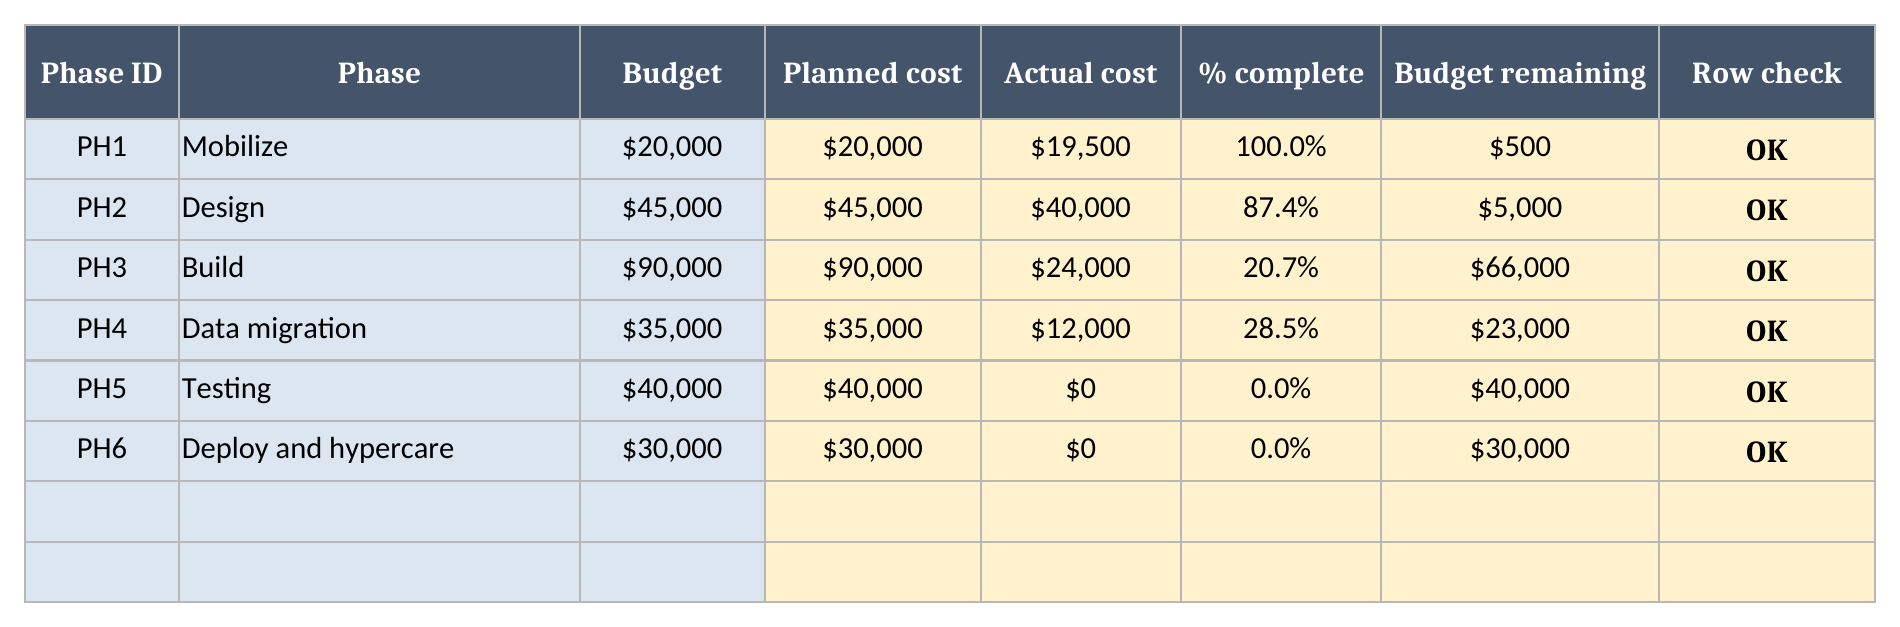
- Phases has one row per phase.
- Tasks has one row per task.
- Dashboard has the status date and the results.
How to set it up
Setup takes a few steps, and you should do them in order, because Tasks reads the phase list and the Dashboard reads both sheets. Start by replacing the sample phases and budgets, then move on to the task rows, and finish by setting the status date once your real schedule is in place.
- If Excel opens the file in Protected View, click Enable Editing so the formulas calculate.
- On Phases, replace the sample phases with your own, and keep each Phase ID unique because Tasks uses it as the key.
- On Tasks, replace the sample rows with your schedule. Pick each Phase ID from the dropdown and pick each predecessor from the Task ID list.
- Type a percent complete for each task as you go. Leave it at zero until work has started on that task.
- On Dashboard, set the status date. The sample date is typed so the sample numbers stay fixed. Type a new date at each review.
- Fix every Row check that is not OK, then confirm Data check on Dashboard reads OK.
Keep owners short and consistent, because a filter on the Owner column is the fastest way to prepare for a weekly review. Keep actual costs current too. A budget rollup is only as useful as the last time someone updated it.
I also keep one rule for the review itself. Clear conflicts before you discuss percent complete. A conflict means the schedule disagrees with itself, and any percentage built on that schedule will mislead the room until the dates are fixed.
When you add a task, type it in the next empty row. The calculated columns are already filled down to the last row, so you never need to copy a formula. The same is true on Phases, so a new phase picks up its rollups as soon as you type its ID.
How percent complete is calculated
Percent complete here is weighted by duration, not counted by task, so a long task moves the number more than a short one. Each task earns its duration in days multiplied by its own percent complete, and each phase divides earned days by total days. That keeps a two-day task from outweighing a two-month one.
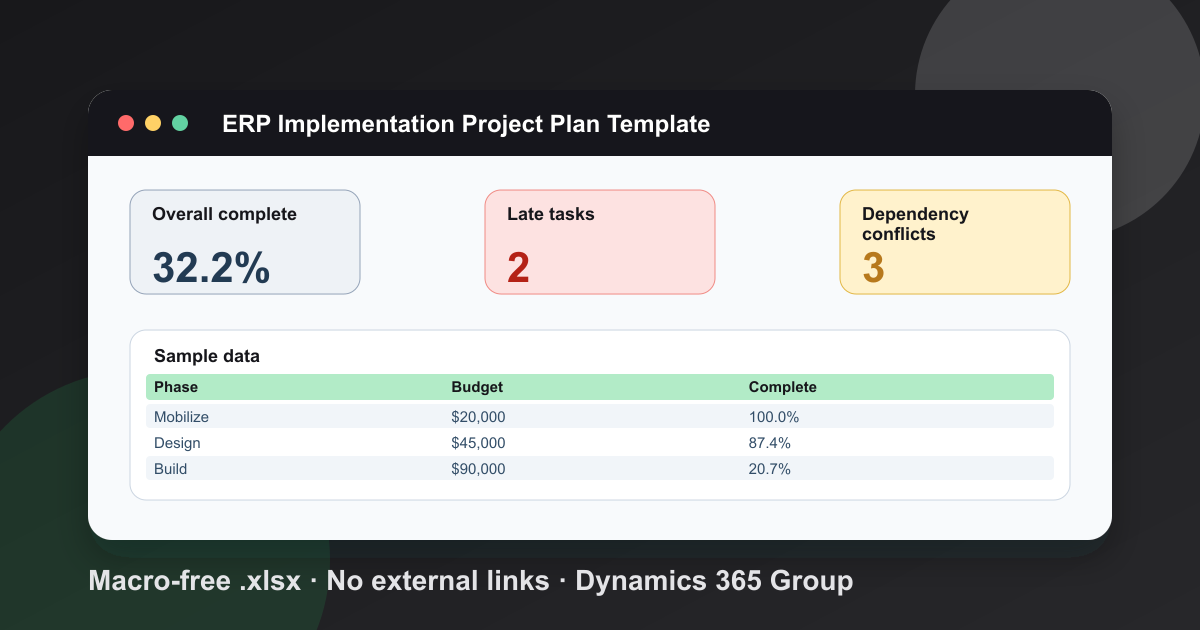
The Design phase shows it. T-03 runs 26 days and is done. T-04 runs 12 days at 60 percent, so it earns 7.2 days. Design reads 87.4%. Across the plan that is 98.9 earned days of 307, or 32.2%.
How dependency conflicts are flagged
A task shows Conflict when its predecessor finishes on or after the day the task starts, and the check uses the Task ID you typed, so your own ID format works. The flag appears as soon as the dates disagree, which gives you time to move a date before the plan slips further.
In the sample, T-05 starts on 2027-03-01 while T-04 finishes on 2027-03-05. The sample shows 3 conflicts. Move T-02’s start to 2027-01-16 and one clears.
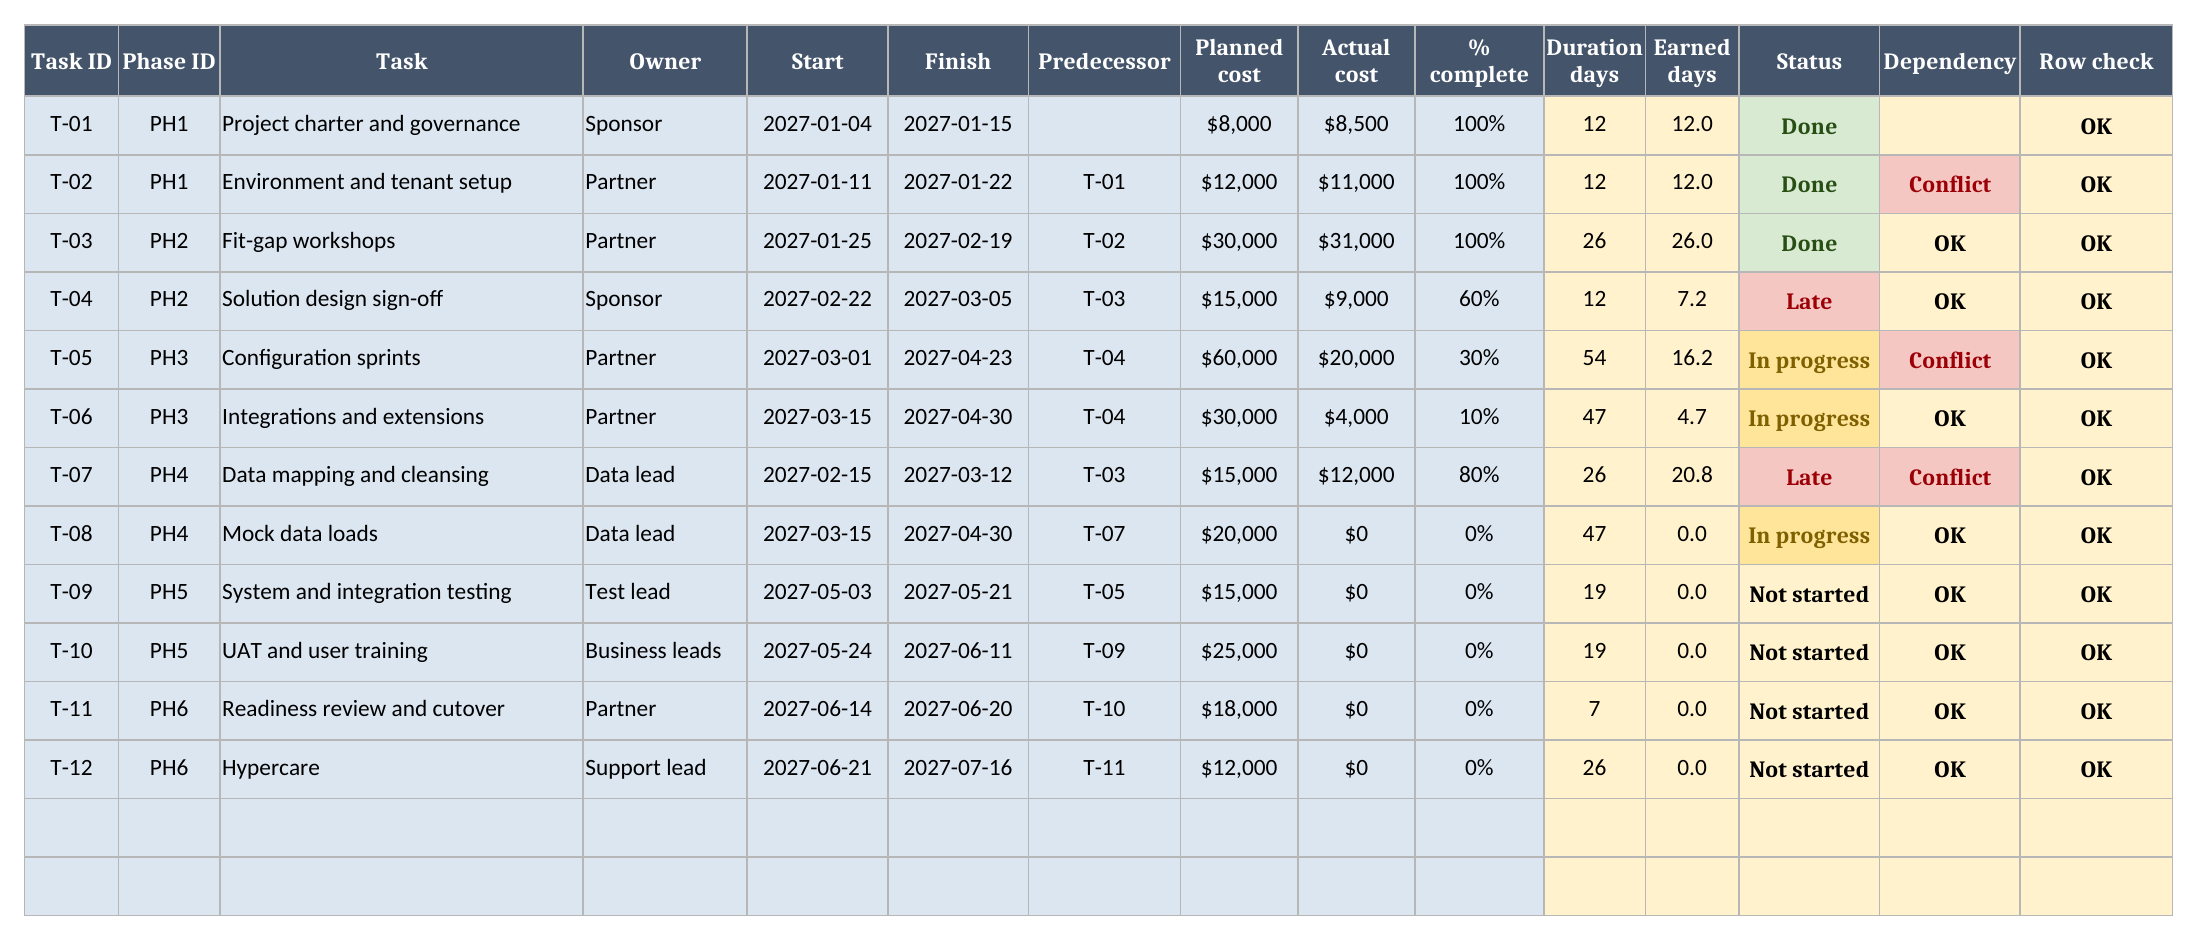
A worked example from the sample
The sample uses a status date of 2027-03-15, which sits about ten weeks into the schedule. On that date some tasks are done, two are behind and several are running. The numbers below come straight from the Dashboard sheet, so you can compare them with your copy after you download it and open it.
| Metric | Value |
|---|---|
| Overall complete | 32.2% |
| Total budget | $260,000 |
| Actual cost | $95,500 |
| Budget used | 36.7% |
| Late tasks | 2 |
The budget is sample data. It is not a benchmark for a real project, and I would not use it to estimate one.
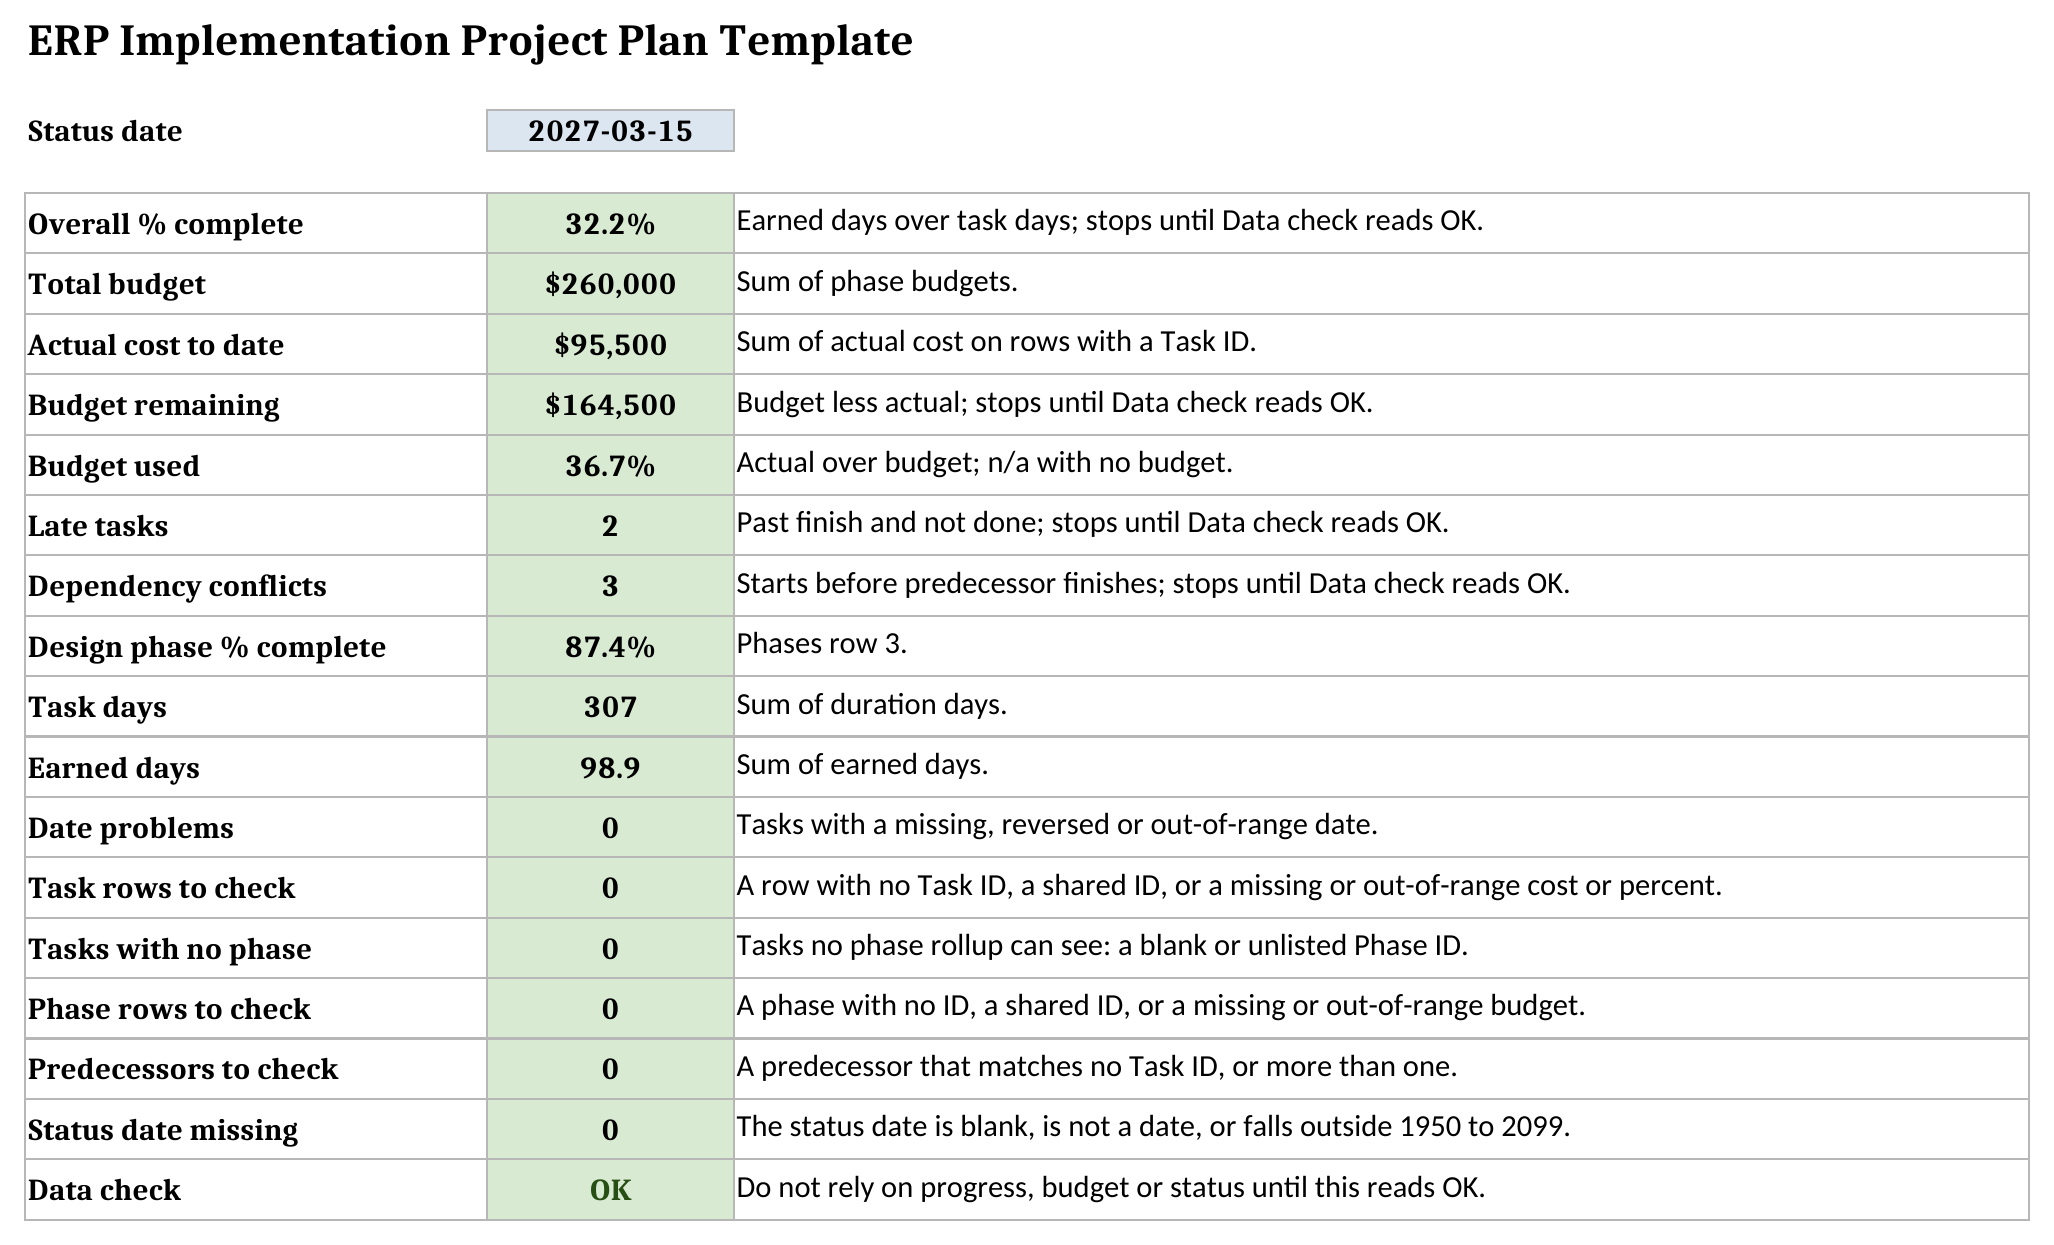
How the phases map to Microsoft guidance
The six phase names are my own practice, not a Microsoft standard. Microsoft describes five phases in Success by Design: Discover, Initiate, Implement, Prepare and Operate. The sample assumes Discover finished before the first task on 2027-01-04, so the first row is already Initiate work.
Mobilize and Design map to Initiate. Build and Data migration map to Implement. Testing spans Implement and Prepare: system and integration testing supports Implement, while final UAT and user training belong to Prepare. Cutover preparation belongs to Prepare, and live stabilization and hypercare belong to Operate. Microsoft says that by Prepare the team “has built and tested the solution and is preparing for the final round of user acceptance testing (UAT) and training”, and that the goal of Operate is stabilization. Microsoft has more on the project plan and on choosing a methodology.
Data work deserves its own lane in the plan. Our guide on how to migrate data to Dynamics 365 goes deeper. Later, the upgrade process matters too.
Using it in Google Sheets
The file is a plain .xlsx with no macros, so you can bring it into Google Sheets with the normal import. In Google Sheets choose File, then Import, then Upload, pick the file, and choose Insert new sheet(s). Formatting can differ between the two products, so check the results, dropdowns and colours after import before you rely on it.
What the plan does not do
A row with a missing, reversed or out-of-range date shows Check dates, and overall percent complete shows the same until you fix it. Use dates from 1950 to 2099. A task with no Task ID, a shared ID, a Phase ID that is not on Phases, or a cost or percent that is blank or out of range shows a warning in Row check. Percent complete and budget remaining by phase, overall percent complete, budget remaining, budget used, late tasks and dependency conflicts then read Check data until Data check on Dashboard reads OK. A blank is not a zero, so type 0 for no cost.
This is a spreadsheet, so it has limits worth stating before you commit a project to it. It does not move dates for you when a conflict appears. It does not model resource loading, and it does not send reminders. It holds up to 299 tasks and 49 phases, because the formulas and dropdowns stop at those rows.
If you need automatic rescheduling, use a scheduling tool and keep this file for the rollup. More free tools sit on our tools page. Download the ERP implementation project plan template when you are ready.
Frequently Asked Questions
What phases does this ERP implementation project plan template use?
Six working phases: Mobilize, Design, Build, Data migration, Testing, and Deploy and hypercare. The names are my own practice, not a Microsoft standard, and the post maps them to the five Success by Design phases.
How is percent complete calculated: by task count or by duration?
By duration. Each task contributes its duration in days multiplied by its percent complete.
How does the template flag dependency conflicts between tasks?
A task shows Conflict when its predecessor finishes on or after the day it starts. A predecessor that matches no Task ID shows a warning instead, and Row check flags a blank or shared ID. Late tasks, dependency conflicts, percent complete and budget remaining then read Check data until Data check on Dashboard reads OK.
Does the template work in Google Sheets?
The file is a plain .xlsx with no macros. In Google Sheets use File > Import > Upload and choose Insert new sheet(s). Formatting can differ, so check the results, dropdowns and colours after import.
Can I use it for Business Central and for Finance and Operations projects?
Yes. The workbook does not depend on the product. Rename the phases and tasks to fit the scope of your rollout.
Free tool
Calculate Your Dynamics 365 Migration ROI
See how much you could save with a free, instant ROI estimate. No signup required.